07. Quiz: Detect Lane Lines
Line Detection and Navigation
Now it's your turn to apply what you know about the Hough transform on a different image. The Hough transform is often used in simple navigation techniques to find and align vehicles with lane lines or other well-defined paths.
So, in this example, you'll use the Hough transform to detect lane lines in an image of a road.
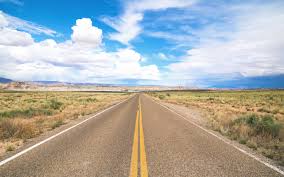
Road marked with lane lines
The starter code will result in too many lines detected, so in this quiz, it's up to you to modify the parameters of the Hough transform so that the lane lines are detected and not any lines in the sky or scenery.
You should aim for line detection that looks like the image below.
Tip: You can filter lines by calculating their slope, m, (m = change in y / change in x) and only drawing lines on an image that fall in a certain range of slope values. Also, you can change the values for the Canny threshold but the provided values should work fairly well.
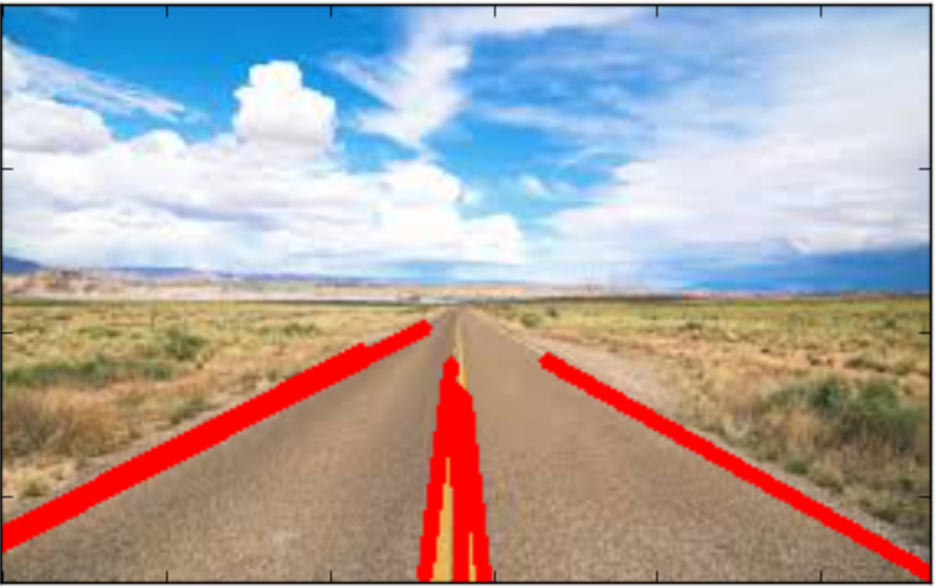
Line detected image
Start Quiz: